Story kicking big data
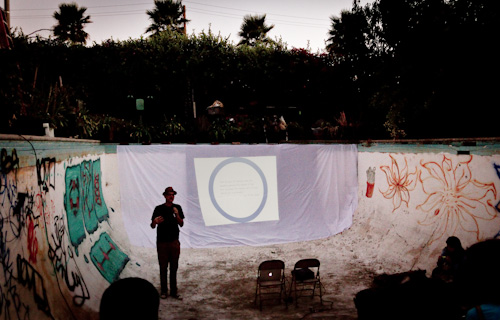
A couple of days ago I attended an event called That Time a Story Kicked Big Bad Data’s Ass. The event was hosted by GameChangers in the pool (!) of gangster gardener Ron Finley . Lucky for us, there was no water in the pool!
GameChangers is a consultancy company that use improvisation techniques and narrative design to help their clients improve their communication and develop brand strategies. Consequently, the event itself was filled with stories and improvisation, which was refreshing.
Infobesity – The Tyranni of Data
The topic of the night was the relationship between big data and stories. Even though it was made clear that we should embrace big data, the take home message was that we need stories to understand and communicate data, and that stories can achieve much that data can’t. The proliferation of big data and lack of stories results in ‘infobesity’.
Mike Bonifer pointed out that stories can create a vision for the future, while data can only show us a snapshot of the past. Stories are experienced in the present, and speak to our unconsciousness. Relating this to my own project, this inspires me to look for ways of integrating data visualization and stories on multiple levels: from visualizing stories, to stories of visualization.
The Tyranny of Stories
However, stories also have a darker side, which Mike referred to as ‘The tyranny of storiesâ€. People can be persuaded to buy into a story based on false premises, like signing up for a subprime mortgage, or to invade a country based on factual lies. Consequently, the power of stories makes them suitable for misuse, just like data and statistics can easily be misused.
Data visualization as a story space
Comparing big data with stories is, of course, somehow like comparing apples and oranges. I agree that data needs a story if you want to communicate something specific. However, in the context of data exploration and analysis, for example, you might want to visualize and present data without a tightly choreographed story. Such a visualization would allow the user to navigate and explore the data him/herself, and thereby create new, previously unknown stories. In that way, big data becomes a ‘story space’ in which a multiplicity of stories can reside.
Thanks to Mike and the rest of the GameChangers for an extraordinary event filled with stories to remember!
2 Comments to Story kicking big data
Scientific research can also be seen as creating a story out of (often big) data, but science tends to proceeds, like courtrooms, by story, critique, and counter-story. That’s not always the best way to support innovation and creative thinking. We need to think about how stories are used, about the kind of story-culture they live in.
One such culture is the exploratory one of many stories, many points of view on the same data, complementary, like Roshomon, or Bohr’s notion that any reality is too complex to be understood through just one story.
Jay, something Jon Olav didn’t mention is that Bohr’s notion and the Rashomon Effect in networks is accounted for in growing body of work around the quantum physics of storytelling. We touched on this briefly at the presentation in Ron’s pool. (The graffiti art on the left wall of the pool, painted that night by Ron’s son, Delfin Finley, references it.) J.O. thank you for your observations. I am grateful.
Leave a comment
Search
Recent posts
- SpotTrack: Award for Design Excellence
- VizBox Bergen og årets geogründer
- Fulbright report: six months at the School of Cinematic Arts in Los Angeles
- The VizBox Experiments
- TopoBox: exploring a tangible dataviz platform
- Norway in 3D part I: from DEM to 3D surface
- Using visualization for understanding survey data
- Story kicking big data
- Fulbright project: Dynamic Information Visualization
- Visiting Fulbright scholar at USC in Los Angeles
- (E)motional design paper at DANDE2012
- 3,5 års arbeid på 6 minutt og 40 sekund
- PhD thesis online
- New video: Kinetic Interface Design
- Presentasjon: Skisser utanfor boksen

September 27, 2013