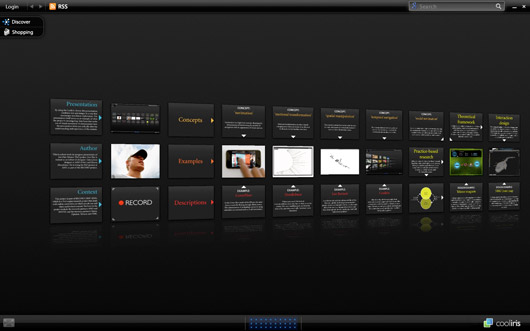
My project presented with Cooliris
Maziar Raein, one of the external lecturers in the PhD course, gave us the task to choose about 15 images related to our PhD project, and write something about them. As I understood the task, we were encouraged to experiment with modes of presenting text and images together.
I chose to use the Cooliris interface for giving a general presentation of my project. In my opinion, this form of presentation encourages a “non-linear exploration”. The presentation itself serves as an example of what the project is investigating: interfaces that make use of visual movement in navigation. I believe it also demonstrates how the presentation form (or the interface) can radically alter the understanding and experience of the content.
Click here to go to the presentation.
1 Comment to My project presented with Cooliris
[…] I will discuss and analyse navimation through a navimational interface. I have already done a small experiment on this and plan to take this further in some way or another. This is not easy to do in regards to […]
Leave a comment
Search
Recent posts
- SpotTrack: Award for Design Excellence
- VizBox Bergen og årets geogründer
- Fulbright report: six months at the School of Cinematic Arts in Los Angeles
- The VizBox Experiments
- TopoBox: exploring a tangible dataviz platform
- Norway in 3D part I: from DEM to 3D surface
- Using visualization for understanding survey data
- Story kicking big data
- Fulbright project: Dynamic Information Visualization
- Visiting Fulbright scholar at USC in Los Angeles
- (E)motional design paper at DANDE2012
- 3,5 års arbeid på 6 minutt og 40 sekund
- PhD thesis online
- New video: Kinetic Interface Design
- Presentasjon: Skisser utanfor boksen

March 30, 2009